Bitcoin Update
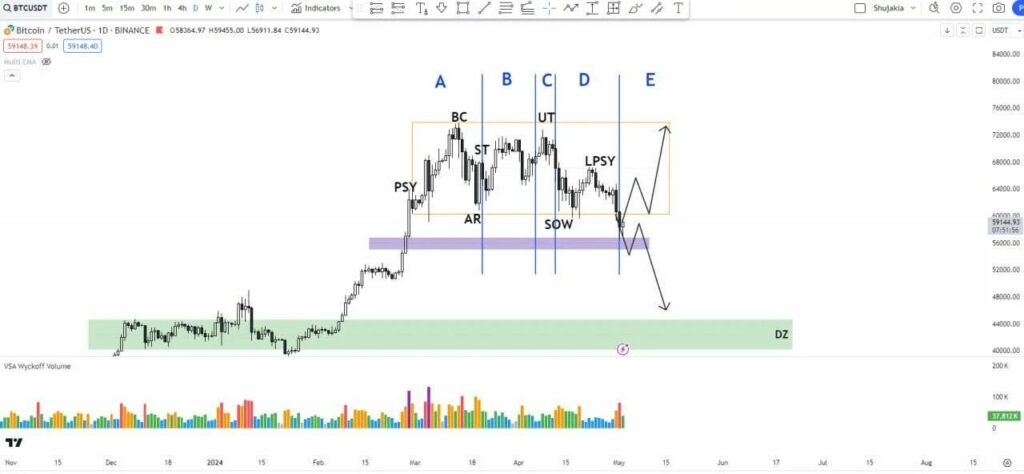
While we typically do not apply the Wyckoff method to cryptocurrencies due to their tendency to deviate from traditional market models, we have observed that a significant portion of wave structures align closely with Wyckoff principles, demonstrating an accuracy rate of over 70%. This observation can be tested by examining altcoin waves during the 2021 and 2023 seasons.
Let’s delve into the present BTC situation from this perspective.
We are currently in Phase E, where buyers anticipate today’s candle to form a reversal candle, providing them with an optimal entry point within this pattern (known as the Spring Point). Simultaneously, sellers are poised to initiate short positions upon witnessing a breakout of the orange box model we have delineated.
BTC has exhibited a consistent uptrend for six months, spanning from November 2023 to April 2024 (based on monthly candles). Consequently, it is reasonable to anticipate a temporary pause in BTC’s upward trajectory. The model we are referring to suggests distribution, indicating that BTC may require this adjustment phase to sustain further growth.
Furthermore, let’s explore why BTC did not experience sustained growth even after reaching the $73,000 area, despite positive news such as ETF approvals and other developments that generated significant trading volumes and institutional buying. This observation prompts the question: why did the price remain stagnant?
Presently, BTC has broken out of the box model with notably higher volume compared to previous days, indicating a robust breakout. Taking these factors into consideration, we may be witnessing a Wyckoff Distribution model unfolding.
Please note that this analysis represents a personal perspective. We encourage you to validate or contribute your insights below this article. All viewpoints and analyses will be acknowledged and welcomed for further discussion.
Altcoin Overview
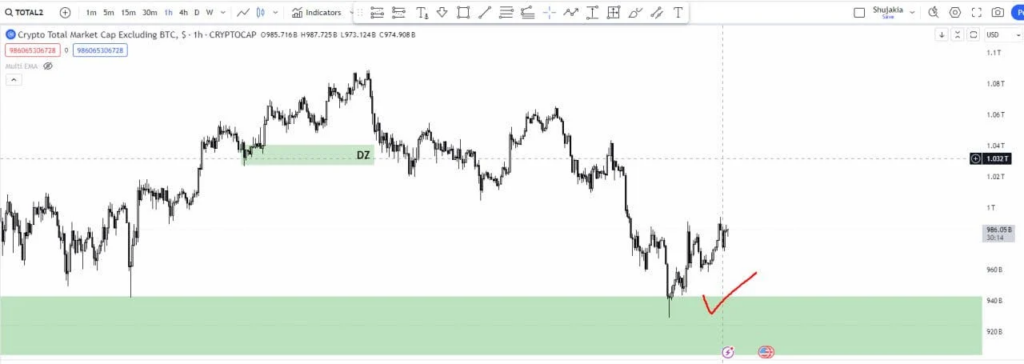
In the current analysis of Altcoins, we focus on Total2, where the resistance area around 950 billion represents a critical juncture.
This resistance area is characterized by a “clean” OB (Order Block). Observing how Altcoins approached this region and subsequently reacted strongly, showing clear rejection, suggests a period of recovery for Altcoins, at least in the interim.
Top Altcoins have demonstrated impressive recovery rates:
1/ $PEPE: 24%
2/ $AR: 20%
3/ $BONK: 19%
4/ $W: 22%
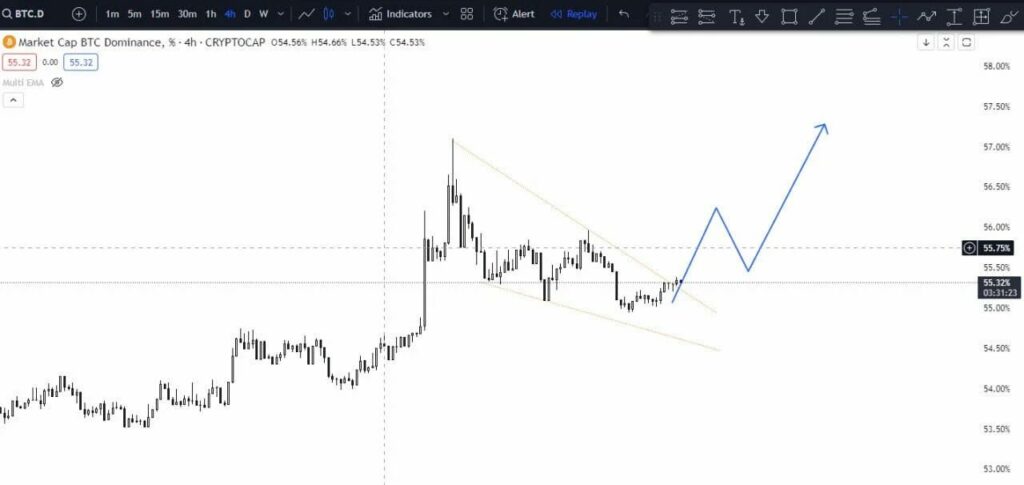
Additionally, BTC.D (Bitcoin dominance) has recently broken its upward trendline. Despite Bitcoin breaching support at $60,000, Altcoins have largely avoided establishing a new bottom compared to April 14. This development signals positivity within the Altcoin market.
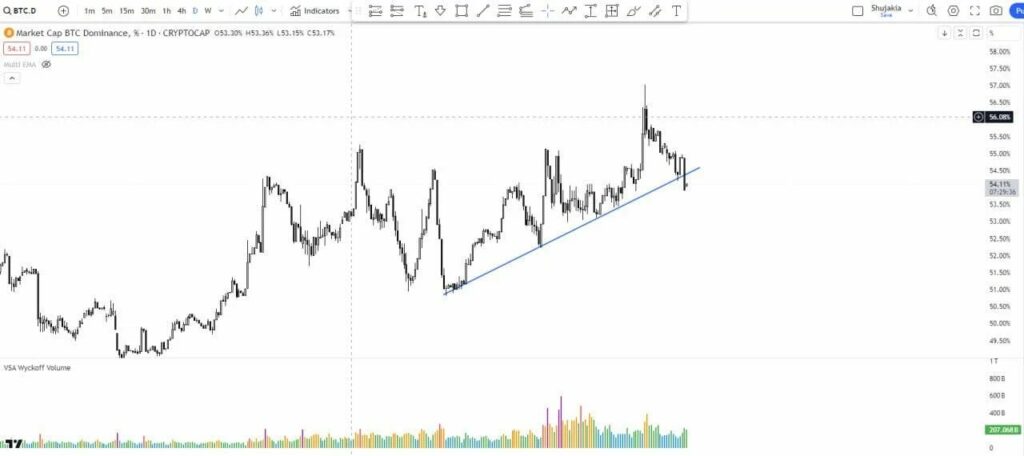
Looking ahead, while we may not anticipate immediate significant gains in Altcoins, it is likely that Altcoins will consolidate within the current range for approximately 1-3 months, establishing an accumulation phase before potentially resuming growth towards the end of 2024.
In summary, market conditions are improving, and the outlook for this year remains bullish.
Signal Call
Below are some of our ongoing spot signals in our private trading group:


Do you want to receive more Trading Signals like these?
First 30 slots are open for FREE ACCESS => JOIN NOW

