The latest data from the US Labor Department reveals that US producer prices experienced a year-on-year increase of 1.1% in May, marking the 11th consecutive decline in the YoY rate-of-change and the lowest print since December 2020. The report indicates that inflation pressures are subsiding, primarily driven by a decline in energy goods and food costs.
This development offers potential relief to consumers and strengthens the case for the Federal Reserve to maintain its current interest rates. Let’s dive into the details of the US Producer Price Index (PPI) data and its implications for the economy and consumers.
What is US PPI & Core PPI?
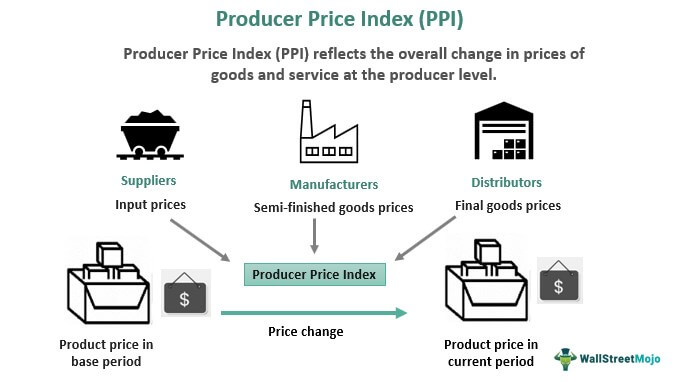
The U.S. Producer Price Index (US PPI) is a measure of the average change over time in the prices received by domestic producers for their output. It tracks price movements at the producer level, capturing inflationary pressures in the early stages of the supply chain. The PPI includes prices for both goods and services.
The Core PPI is a subset of the PPI that excludes the volatile food and energy components. By removing these items, which can experience significant price fluctuations, the Core PPI provides a more accurate measure of underlying inflationary pressures in the production process. It allows analysts and policymakers to assess the trend in prices without the influence of temporary factors that may not reflect broader economic conditions.
US Producer Prices See 1.1% YoY Increase, Lowest Since December 2020
According to the Labor Department’s report, US producer prices fell more than expected in May, primarily driven by declining energy goods and food costs. This downward trend indicates a potential abatement of inflation pressures across the broader economy, which could eventually provide relief to consumers. The annual increase in producer inflation last month was the smallest in nearly 2-1/2 years, further supporting the notion of subsiding inflationary forces.

- US PPI Y/Y 1.1% (Expect = 1.5%, previous month = 2.3%)
- US PPI M/M -0.3% (Expect = -0.1%, previous month = 0.2%)
- Core PPI Y/Y 2.8% (Expect = 2.9%, previous month = 3.2%)
- Core PPI M/M 0.2% (Expect= 0.2%, previous month = 0.2%)
The decline in producer prices, coupled with the modest increase in consumer prices, suggests that there are fewer price increases awaiting consumers in the pipeline. This development brings a sense of relief to the inflation-weary American public. While inflation is still impacting the economy, there is optimism that inflation will gradually decrease to more manageable levels as the pandemic-induced demand surge dissipates.
Price dynamics in different sectors
The producer price index for final demand decreased by 0.3% in May, following an unrevised 0.2% rise in April. This decline was mainly driven by a significant drop of 6.8% in energy prices, with gasoline prices plummeting by 13.8%. Food prices also fell by 1.3%, reflecting lower costs of eggs and vegetables for the second consecutive month. In contrast, the cost of services rose by 0.2%, driven by various factors such as margins for automobiles and parts retailing.
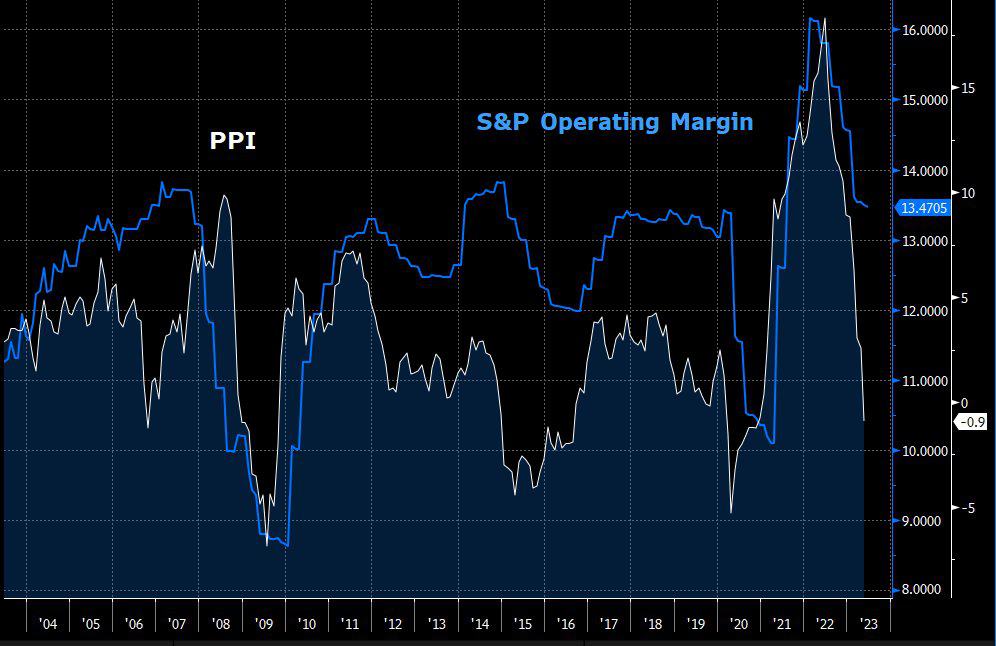
Core PPI Remains High, Underlying Inflation Concerns Persist
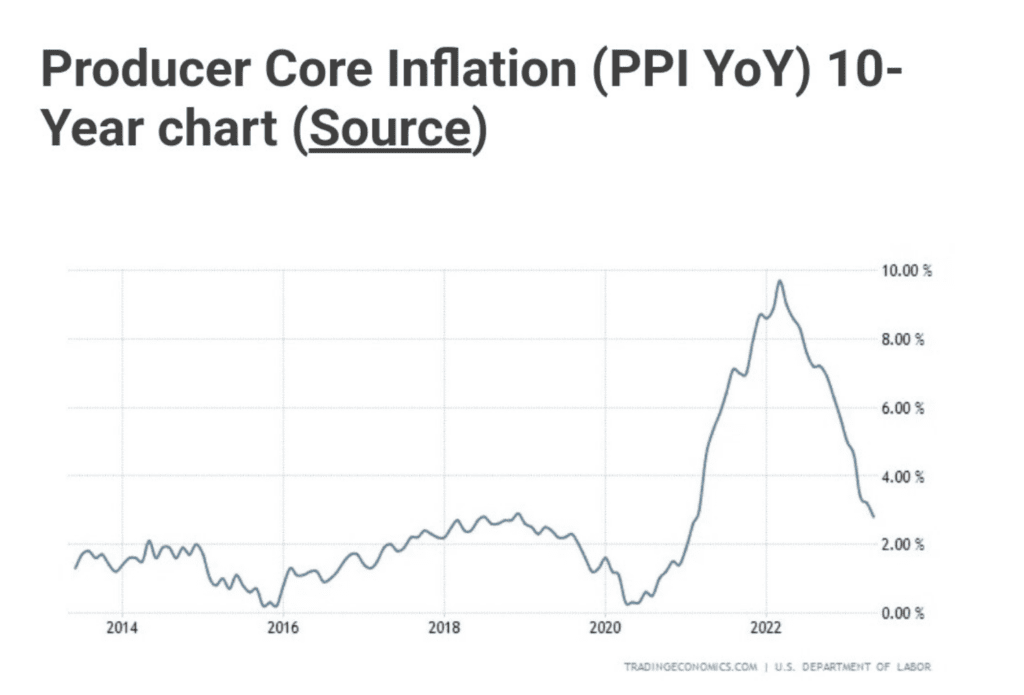
Excluding the volatile food and energy components, core goods prices edged up by 0.1% in May, matching April’s increase. This trend supports the expectation that the economy might experience a period of disinflation or even deflation in consumer goods.
However, some economists remain skeptical, suggesting that consumers may have become accustomed to higher price levels, making it unlikely for easing input costs to translate into lower prices. The narrower measure of core PPI, which excludes food, energy, and trade services components, remained unchanged after a slight increase of 0.1% in April.

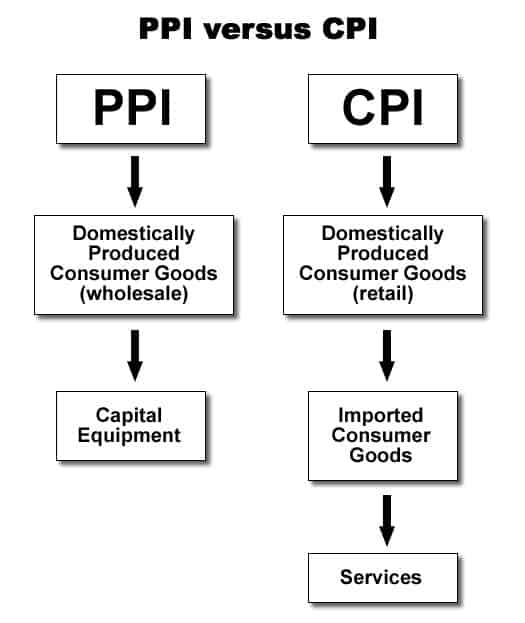
While the US PPI indicated a decline in prices, the Consumer Price Index (CPI) data for May 2023 showed a continued upward trend in consumer inflation. The CPI grew at a year-on-year rate of 4.0%, suggesting higher inflationary pressures compared to the PPI’s 1.1% increase over the same period. On a monthly basis, the CPI rose by 0.1%, albeit at a slower pace than the forecasted 0.2%. In contrast, the PPI experienced a decline of 0.3% month-on-month.
Related article: US CPI Signals Stable Interest Rates as Fed Maintains Outlook – May 2023
When examining the Core CPI, which excludes food and energy components, it grew at a year-on-year rate of 5.3%, indicating persistent inflationary pressures. The core CPI remained unchanged at 0.4% on a monthly basis, aligning with the previous month’s reading. In comparison, the core PPI increased by 0.2% month-on-month.
These divergent trends between the US CPI and US PPI suggest that while producer prices have weakened due to factors such as declining energy prices, consumer inflation remains elevated. The CPI data highlights the ongoing challenges faced by consumers in managing higher prices for goods and services, indicating a potential disconnect between producer and consumer price dynamics.
Possible Impacts To The Crypto Market
The impact of US PPI and US CPI data on the crypto market can vary depending on several factors. Here are a few possible scenarios:
- High Inflation: If the CPI shows high inflationary pressures, it could lead to increased interest in cryptocurrencies as investors seek alternative assets to hedge against inflation. Cryptocurrencies like Bitcoin have been viewed by some as a potential store of value during inflationary periods.
- Monetary Policy Response: If high CPI inflation persists, it may prompt central banks, such as the Federal Reserve, to consider tightening monetary policy by raising interest rates. This could have a negative impact on the crypto market as higher interest rates can make traditional investments more attractive relative to cryptocurrencies, which are often considered riskier assets.
- Market Sentiment: PPI and CPI data can influence overall market sentiment. Positive data suggesting moderate or controlled inflation could boost confidence in the economy and potentially lead to increased investment across various asset classes, including cryptocurrencies. On the other hand, if inflationary pressures are higher than expected, it could create uncertainty and lead to cautious investor behavior, affecting the crypto market as well.
- Risk Perception: Cryptocurrencies are often seen as speculative and volatile assets. In times of economic uncertainty or market turbulence caused by inflation concerns, investors may become more risk-averse and shift their investments to more traditional and stable assets. This could potentially result in a temporary downturn in the crypto market.
It’s important to note that the crypto market is influenced by a wide range of factors, including global economic conditions, regulatory developments, and investor sentiment. While PPI and CPI data can provide insights into inflationary pressures, their direct impact on the crypto market is complex and can be influenced by multiple variables.
Conclusion
The latest US PPI data indicates a notable easing of producer prices, primarily driven by declines in energy goods and food costs. This trend suggests that inflation pressures are subsiding, offering potential relief to consumers. The Federal Reserve is expected to maintain its current interest rates in response to these developments.
While core producer prices remain high, there is optimism that inflation will gradually decrease to more manageable levels in the future.
